Comparison of global methods for the image contrast enhancement based on biometric images
Dorota Smorawa
,Mariusz Kubanek
Journal of Applied Mathematics and Computational Mechanics |
 Download Full Text |
COMPARISON OF GLOBAL METHODS FOR THE IMAGE CONTRAST ENHANCEMENT BASED ON BIOMETRIC IMAGES
Dorota Smorawa, Mariusz Kubanek
Institute of Computer and Information
Sciences, Czestochowa University of Technology
Częstochowa, Poland
dorota.smorawa@icis.pcz.pl, mariusz.kubanek@icis.pcz.pl
Abstract. This work presents the methods of improvement of biometric images contrast, and it corresponds to one of the main parts of the biometric system that verify identities based on distribution of the blood vessels in a hand. The acquisition of the palm blood vessel pattern causes noises that can prevent the right verification. To solve this problem, we investigate four different methods of contrast enhancement, and provide an evaluation of their performance by using four different quantitative contrast measurement methods.
Keywords: contrast enhancement, image analysis, biometric image
1. Introduction
Currently, image processing is used in almost every field of science including satellite images, medical diagnostic or anthropology. It is difficult for a system or human to analyze images due to their quality and inability to distinguish the details contained within. High quality of the image is very important because it has a significant influence on the decision taken by a system or human.
In order to provide an effective analysis of an image obtained by an optical device, such as scanner, imager, or even camera, firstly it is necessary to improve its quality. The most commonly used methods that can be applied here are based on providing a set of transformations including:
– noise reduction,
– increasing the sharpness of the image,
– stressing the image components.
Such a transformations allow us to enhance a contrast, improve a dynamic range of image features and identify the most characteristic ones.
The specification of the image does not allow us to fully utilize the assumptions of the classical theory of digital image processing. The lack of unified theory and general rules make it difficult to select an appropriate algorithm and to estimate its efficiency. Currently, scientists have problems with the choice of an appropriate contrast enhancement for the image and they usually select them intuitively.
2. Related work
Improving the image quality to take full advantage of image contrast enhancement methods has been the subject of much investigation over the years. For example, photos of a face, fingerprints, main lines of the hand [1, 2], or palm blood vessels [3], or even knuckles [4] are used for the biometric systems construction.
Their quality is essential for proper system operation. In the literature dealing with the subject, you can find a lot of ways to improve the image contrast, which means its quality, and the ability to distinguish the contained details [5-8]. In the work [9] the STFT methods, as well as contrast filtering were used. The aim of which is to improve the contrast of images that contain fingerprints. The authors study present the prove that these methods are useful even for low-quality fingerprints. In the next work [10], the authors present a 2-stage algorithm of image contrast enhancement, where the main contribution is to increase the performance at biometric systems that are based on iris and face images. In another work [11], the authors describe the performances of the most often used methods for the image contrast enhancement based on vein pattern and include stretching and histogram equalization. In the work [12] the authors present research of images based on dorsal hand vein. To the image contrast enhancement, the authors used the most popular global methods for the image contrast enhancement. In another work [13] the use of global transformation methods are described and two-parameter transformations of image brightness levels whose task is to enhance the contrast of the image. The results show the superiority of the latter proposal. In another study, the authors [14] show the problem of low-quality tomographic (CT) images. The authors examined several commonly used methods and the best results were obtained with IGF and ADF algorithms. In another work [15] the authors use a wavelet transform to medical image quality improvement.
3. The workstation at research
All the that provided in this paper are performed using the following hardware components:
– CCTV cameras with infrared active matrix,
– IR illuminator,
– A tripod for the camera,
– Plates with auxiliary pins.
The near-infrared light is partially absorbed by hemoglobin located in the veins, which enables a picture to be taken of the structure below the outer layer of skin to produce a natural contrast of the pattern of blood vessels.
In the process of blood vessel acquisition in the hand, only a fragment of a hand the size of 380 x 380 pixels is considered and taken.
In the carried out studies there were two databases considered, our own base and the CASIA database [16]. Each of these contains data collected from 100 users. Each user had 12 pictures taken of the left and right hand (for 850 nm). Two pictures of the hand vein pattern were chosen from each base. Sample contrast enhancement is shown in Figure 1.
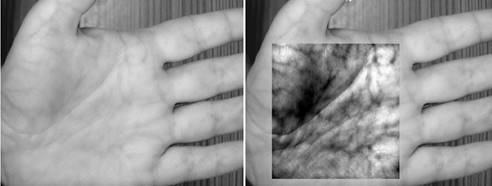
Fig. 1. Sample image of palm vein after using contrast enhancement from our own database
4. Improving image contrast by applying global transformations
The image taken during the acquisition is often low-contrast, which is manifested by difficulties in distinguishing its details. The image of the pattern of blood vessels is monochromatic characterized by the range of color from 0 to 255. The fact that the entire available range of gray levels is not utilized may result in a low image contrast. To make the image clearer for the proposal methodology, the enhance contrast are applied using the global image transformations.
Global methods enhancing contrast belong to the extensive group of methods to improve the contrast of the image. Knowledge of the levels of gray in a given image is commonly used here. To obtain such information, a histogram of gray levels of the image is necessary. The histogram is most commonly used in methods of stretching the histogram or histogram equalization.
One of the well-known global methods is a single point transformation, also known as linear contrasting [17]. It involves the range of levels of brightness to be transformed to its possibly maximum width. To apply this method we need the information about the lowest and highest values of gray levels present in the image being operated. The change of the gray levels of the input image is performed with the following formula:
| (1) |
where:
a, b - coefficients,
L (i, j) - the brightness level of the element with the image coordinates (i, j),
L* (i, j) - the new brightness level value of the image element after the conversion.
In this case, the range of gray levels [Lmin, Lmax] of the image L is converted into range [Lmin, Lmax]. Lmin and Lmax denote respectively the lowest and the highest pixel value on the input image. The following set of equations is obtained:
| (2) |
where factors a and b are calculated:
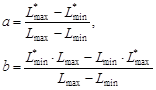 | (3) |
The parameters a and b allow us to arrange the equation (2) into a simpler form (4):
| (4) |
Another essential global transformation, used to enhance the image contrast, is the non-linear stretching method [17], often called gamma correction. The mathematical form of this method is based on the linear contrast method (4), where a power law is used to change the brightness level as a coefficient γ. The coefficient value ranges 0.3 < γ < 3 and the non-linear stretching pattern is as follows:
| (5) |
Another key global transform used to enhance
the quality of the image is the histogram equalization method [18], which is
also called linearization or flattening of the histogram. This operation is
used when the greyscale range of an image
is very narrow. Greyscale values are stretched to a wider band which allows you
to enhance contrast within the low level
area. Transformation of histogram equalization is the point operation ![]() , which converts the input image L(i, j) into the
output image L*(i, j) as follows:
, which converts the input image L(i, j) into the
output image L*(i, j) as follows:
| (6) |
where:
| (7) |
H(x) denotes the values of the input image histogram H(L).
Another popular global transformation, which is often confused with the image histogram equalization, is the stretching of the image histogram method [18]. This transform leads to the conversion of component values for which the image histogram includes all the component values. The transformation is described with the following formula:
| (8) |
where L*(i, j) denotes a new calculated value of the pixel and L(i, j) is the value of the input pixel. The variable a is the lowest value and b is the highest value that a pixel can take. Lmin and Lmax denote respectively the lowest and the highest pixel value on the input image.
5. Complementary methods to enhance the image contrast
During the acquisition of the palm vein pattern, some additional noise and distortion can occur. This effect is strictly connected with the conditions in which the picture was taken. Global transforms improving image contrast cannot cope with these types of problems, therefore some additional methods should be applied. Such methods include smoothing filters and normalization of the image. These methods eradicate the noise and distortion which arise from the acquisition.
The task of smoothing filters is to remove noise from an image by convolution of the input image with the appropriate masks. The convolution operation for a discrete image function L and the mask can be represented in the following equation [18]:
| (9) |
After the image has been filtered, the values in the image can slightly exceed its range. In consequence, it is necessary to perform image normalization [19], by changing the range at particular points of the source image L(i, j) using a predetermined range of values onto the output image L*(i, j). Image normalization can be represented by the formula, where the coefficient γ has a constant value:
| (10) |
6. Performance of the image contrast enhancement
In terms of computer processing and monochrome images analysis, there is still a problem related to an objective assessment of its quality. These types of images, the concept of contrast refers to the difference between the values of gray levels present in the image. The problem is the assessment of monochrome images obtained during the acquisition. The problem is also to assess whether the method to enhance the contrast fulfilled its purpose or not. For this purpose an experimental study on two photo databases with images of blood vessels of the hand was carried out. To assess the quality of the images, three methods of image contrast were applied.
In literature there are many different methods of image contrast assessment. The most commonly used methods of evaluating image contrast globally are:
| (11) |
and
| (12) |
These methods take into account the maximum and minimum pixel present in the image to calculate the contrast ratio. Measure (11) in the literature is also known as Michelson factor [20].
In formulas (11) and (12) Lmax
and Lmin respectively indicate the minimum and the maximum
value within all gray levels in the image.
Coefficient ![]() is the average
value of gray levels in the image, which can be described by the following
formula:
is the average
value of gray levels in the image, which can be described by the following
formula:
| (13) |
where:
L(i, j) - value of the gray level assigned to the pixel coordinates (i, j),
M, N - image size.
In the articles [19, 21] we can find the information that the image contrast assessment methods (11) and (12) are burdened with errors. The result of these methods depends on instances of individual pixels with extreme values appearing in the image. The author gives the rating function, which does not contain these errors:
| (14) |
where:
L - is the range of values that can be appointed to gray levels in a given coding method,
![]() - the average value of the gray
levels in the image
- the average value of the gray
levels in the image
L(i, j) - the value of gray levels assigned to the pixel coordinates (i, j)
M, N - size of the image
value 4 - the number which standardizes the coefficient value
Another similar measure of contrast assessment is a modified measure (14) described by the formula (15):
| (15) |
In this method, the square of the difference is replaced by the absolute value and the range of gray levels which can apply an image in a given coding method, is not squared.
7. Research
To carry out the experimental part, two applications, which enhance the image contrast, were created. The first is comprised of global transforms, i.e.: the histogram stretching, linear and nonlinear stretching, and histogram equalization.
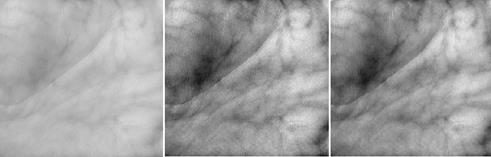
Fig. 2. Palm vein after using histogram stretching and normalization plus blurring
Four measures of evaluating the image contrast are performed for each image which has been treated with these transforms. These measures are kS, kM, kW and kABS, which were described in the above section. Such additional functions as normalization and blurring are applied on each transform by the other application. Figure 2 shows the results for histogram equalization and image blurring plus normalization methods of own database. The following tables present the results obtained from both the own and CASIA database.
Table 1
Results for all photos from our own database
|
Measure Method |
kS |
kM |
kW |
kABS |
|
Histogram stretching |
1.7876 |
0.9922 |
0.0591 |
0.4363 |
|
Linear stretching |
1.7953 |
1.0000 |
0.0612 |
0.4021 |
|
Nonlinear stretching |
2.3126 |
1.0000 |
0.0691 |
0.4538 |
|
Histogram equalization |
1.9997 |
1.0000 |
0.3427 |
1.0147 |
|
HSNB |
1.5098 |
1.0000 |
0.1160 |
0.5862 |
|
LSNB |
1.5927 |
0.9173 |
0.2432 |
0.3727 |
|
NSNB |
2.1006 |
1.0000 |
0.1576 |
0.6748 |
|
HENB |
1.8018 |
1.0000 |
0.4983 |
1.2598 |
|
Input image |
0.7246 |
0.4781 |
0.0178 |
0.2023 |
Table 2
Results for all photos from CASIA database
|
Measure Method |
kS |
kM |
kW |
kABS |
|
Histogram stretching |
1.4843 |
0.9922 |
0.1034 |
0.5248 |
|
Linear stretching |
1.4907 |
1.0000 |
0.1193 |
0.5337 |
|
Nonlinear stretching |
1.7954 |
1.0000 |
0.1479 |
0.6481 |
|
Histogram equalization |
1.9985 |
1.0000 |
0.3456 |
1.0108 |
|
HSNB |
1.2031 |
1.0000 |
0.1728 |
0.6743 |
|
LSNB |
1.4743 |
0.9917 |
0.1079 |
0.5272 |
|
NSNB |
1.5575 |
1.0000 |
0.2693 |
0.8647 |
|
HENB |
1.8171 |
1.0000 |
0.5267 |
1.2932 |
|
Input image |
0.6598 |
0.3797 |
0.0086 |
0.1498 |
Description of tables:
HSNB - histogram stretching and normalization and blurring,
LSNB - linear stretching and normalization and blurring,
NSNB - nonlinear stretching and normalization and blurring,
HENB - histogram equalization and normalization and blurring.
8. Conclusion
Considering analyzed results, a large diversity of contrast grades was observed. This diversity is conditioned by measures used to evaluate the image contrast. Measures kS, kW and kABS make it possible to determine which of the methods to enhance the contrast of the image return the best result. Image contrast assessment calculated with kM is unreliable. The coefficients calculated by means of this measure in almost each case is the value which equals 1. The problem of this measure results from the way it is calculated, which takes into account only the maximum and minimum values of the image. The measure kM is not able to assess the image properly, the image on which any global transform enhancing the image contrast has been carried out.
The study makes it clear that not all measures of evaluating image contrast can be used to assess the image contrast after the global transforms have been applied on the image. The values considered in the calculation of the measure, using the maximum and minimum pixel values in the image, are not subjective measures.
Thanks to the coefficients, calculated with measures kS, kW and kABS we are able to deduce which of the proposed methods to enhance the contrast is the most effective one.
In this paper the universal measures of the image contrast enhancement are used in order of evaluation the image contrast. The obtained results reveal that the decision of selecting the appropriate methods should be supported by the adequate useful measurements.
References
[1] Kubanek M., Smorawa D., Verification of identity based on palm vein and palm-print, Advances in Intelligent Systems and Computing, Soft Computing in Computer and Information Science 2015, 342, 139-146.
[2] Kubanek M., Smorawa D., Adrjanowicz L., Users verification based on palm-prints and hand geometry with Hidden Markov Models, Lecture Notes in Artificial Intelligence 2013, 7895, 1, 275-285.
[3] Kubanek M., Smorawa D., Holotyak T., Feature extraction of palm vein pattern based on two-dimensional density function, Lecture Notes in Artificial Intelligence 2015, 9120, 2, 101-111.
[4] Choraś M., Kozik R., Nowakowski W., Rozpoznawanie osób na podstawie kostek dłoni, Techniki Informatyczne 2011, 4, 92-95.
[5] Wen-Chung K., Ming-Chai H., Yueh-Yiing Y., Local contrast enhancement and adaptive feature extraction for illumination-invariant face recognition, Pattern Recognition 2010, 43, 1736-1747.
[6] Jian-Gang W., Wei-Yun Y., Andy S., Eric S., Person recognition by fusing palmprint and palm vein images based on “Laplacian palm” representation, Pattern Recognition 2008, 41, 1514-1527.
[7] Jianwei Y., Lifeng L., Tianzi J., Yong F., A modified Gabor filter design method for fingerprint image enhancement, Pattern Recognition Letters 2003, 24, 1805-1817.
[8] Hui Z., Francis H.Y., Lam F.K., Image contrast enhancement by constrained local histogram equalization, Computer Vision and Image Understanding 1999, 73, 281-290.
[9] Chikkerur S., Cartwright A., Govindaraju V., Fingerprint enhancement using STFT analysis, Pattern Recognition 2007, 40, 198-211.
[10] Singh R., Vatsa M., Noore A., Improving verification accuracy by synthesis of locally enhanced biometric images and deformable model, Signal Processing 2007, 87, 2746-2764.
[11] Deepak Prasanna R., Neelamegama P., Sriramb S., Rajua N., Enhancement of vein patterns in hand image for biometric and biomedical application using various image enhancement techniques, Procedia Engineering 2012, 38, 1174-1185.
[12] Djerouni A., Hamada H., Loukil A., Berrached N., Dorsal hand vein image contrast enhancement techniques, International Journal of Computer Science Issues 2014, 11, 142.
[13] Vorobel R., Przybyszewski K., Wzmocnienie kontrastu obrazu jako jeden ze sposobów poprawy jego jakości, Automatyka 2008, 12, 3, 723-731.
[14] Węgliński T., Fabijańska A., Poprawa jakości obrazów tomograficznych o niskiej dawce promieniowania, IAPAGOŚ 2013, 4, 7-9.
[15] Du-Yih T., Eri M., Hsian-Min C., Improving image quality in medical images using a combined method of undecimated wavelet transform and wavelet coefficient mapping, International Journal of Biomedical Imaging 2013, 2013.
[16] http://biometrics.idealtest.org
[17] Malina W., Smiatacz M., Cyfrowe przetwarzanie obrazów, Akademicka Oficyna Wydawnicza EXIT, Warszawa 2008.
[18] Wróbel Z., Koprowski R., Praktyka przetwarzania obrazów w programie Matlab, Akademicka Oficyna Wydawnicza EXIT, Warszawa 2004.
[19] Bal A., Ważona lokalna metoda poprawy kontrastu obrazów cyfrowych, Przegląd Telekomunikacyjny 2008, 6, 746-749.
[20] Olsen M.A., Hartung D., Busch C., Larsen R., Contrast enhancement and metrics for biometric vein pattern recognition, Advanced Intelligent Computing Theories and Applications - 6th International Conference on Intelligent Computing, 2010.
[21] Bal A., Porównanie wybranych miar kontrastu obrazów achromatycznych, KNWS 2010, 87-92.