Analysis of damage processes in nanopillar arrays with hierarchical load transfer
Tomasz Derda
Journal of Applied Mathematics and Computational Mechanics |
 Download Full Text |
ANALYSIS OF DAMAGE PROCESSES IN NANOPILLAR ARRAYS WITH HIERARCHICAL LOAD TRANSFER
Tomasz Derda
Institute of Mathematics, Czestochowa
University of Technology
Czestochowa, Poland
tomasz.derda@im.pcz.pl
Abstract. A computational model for the damage analysis in the axially loaded nanopillar arrays was developed on the basis of the Fibre Bundle Model and hierarchical load sharing protocol. The nanopillars are characterised by random strength-thresholds drawn according to the nanoscale Weibull statistics. We study the influence of the coordination number and the number of hierarchy levels on the system strength, size of the catastrophic avalanche and probability of breakdown.
Keywords: stress transfer, probability and statistics, strength, damage mechanics, nanoscale
1. Introduction
The phenomena of fracture and failure of materials are ubiquitous but mostly undesirable. Especially, in materials science and engineering the fracture and damage of disordered materials are intensively investigated problems [1-3]. Under external load, materials undergo a damage process that leads to complete failure if the load increase is not stopped. In this work we study breakdown processes in axially loaded metallic nanopillar arrays [4, 5]. The arrays of nanopillars are encountered in many areas of nanotechnology and reveal the potential applicability as components for the fabrication of electro-mechanical sense devices. To analyse failure in such arrays, we adapt the Fibre Bundle Model (FBM) which is a fundamental statistical approach for studying failure phenomena of heterogeneous materials [6-8]. The essential component of the FBM is the range and form of interaction of elements (fibres). This component is known as load transfer rule and it has considerable influence on the behaviour of the system. In most analyses, the two extreme load transfer rules are explored. The first one is the global load sharing (GLS) rule - the load carried by just destroyed element is equally transferred to all the remaining elements in the system. As opposed to this rule, for the local load sharing (LLS) rule, only nearest surviving neighbours of the failing element absorb its load. In this paper we consider clustering of the nanopillars, and therefore the applied load transfer rule is based on the hierarchical load sharing (HLS) [9-11]. The details of the model are presented in the following section. In the third section we present and discuss the obtained simulation results.
2. Model of nanopillar array
Let us consider an array consisting of ![]() longitudinal nanopillars. The system
is subject to an axial mechanical loading. It is assumed that the nanopillars
are
of equal height and cross-sectional
areas, and whose strength-thresholds
longitudinal nanopillars. The system
is subject to an axial mechanical loading. It is assumed that the nanopillars
are
of equal height and cross-sectional
areas, and whose strength-thresholds ![]() ,
, ![]() to an applied axial load are
independent random variables. Pillar-strength-thresholds (also called critical
loads) are drawn according to the nanoscale Weibull statistics [12, 13]:
to an applied axial load are
independent random variables. Pillar-strength-thresholds (also called critical
loads) are drawn according to the nanoscale Weibull statistics [12, 13]:
 | (1) |
where ![]() is the number of critical defects,
is the number of critical defects, ![]() and
and ![]() are Weibull’s scale and shape
parameters, respectively. It is reasonable to employ nanoscale Weibull
statistics, because at the nanoscale, a small number of critical defects
(possibly one critical defect) can be responsible for the damage of the
specimen, independently from the specimen size [12]. By applying nanoscale
Weibull statistics, simply
considering
are Weibull’s scale and shape
parameters, respectively. It is reasonable to employ nanoscale Weibull
statistics, because at the nanoscale, a small number of critical defects
(possibly one critical defect) can be responsible for the damage of the
specimen, independently from the specimen size [12]. By applying nanoscale
Weibull statistics, simply
considering ![]() , we assume nearly defect-free
structures. The Weibull modulus
, we assume nearly defect-free
structures. The Weibull modulus ![]() being an
index of dispersion of the distribution, is 2 and
being an
index of dispersion of the distribution, is 2 and ![]() .
.
Before the application of the external load,
all the nanopillars in the array are
intact. Then the system is subject to axial load ![]() . In
this paper two loading procedures are employed. The first one is a quasi-static
loading. In this procedure the
external load is uniformly increased from its initial value (
. In
this paper two loading procedures are employed. The first one is a quasi-static
loading. In this procedure the
external load is uniformly increased from its initial value (![]() ) until the destruc-
tion of the weakest intact nanopillar
under the load
) until the destruc-
tion of the weakest intact nanopillar
under the load ![]() attaining strength-threshold
attaining strength-threshold ![]() of this pillar. After the failure
of the weakest pillar, the increase of the external load is stopped and the
load from the broken pillar is transferred to other intact
pillars according to a given load transfer rule. This load transfer may induce
subsequent pillar failures and, as a result, next load redistributions, which can
provoke further failures. If there is no failures after the load transfer, the
external load has
to be increased just to destroy the weakest intact pillar. The above-described
procedure is repeated until all the nanopillars in the array collapse. We assume
that all overloaded pillars fail simultaneously and their load is again
redistributed because all failed pillars carry no load. The second employed
loading procedure is the
application of the finite force to the system. In this approach the external load
is kept constant during the entire loading process. After the application of
load
of this pillar. After the failure
of the weakest pillar, the increase of the external load is stopped and the
load from the broken pillar is transferred to other intact
pillars according to a given load transfer rule. This load transfer may induce
subsequent pillar failures and, as a result, next load redistributions, which can
provoke further failures. If there is no failures after the load transfer, the
external load has
to be increased just to destroy the weakest intact pillar. The above-described
procedure is repeated until all the nanopillars in the array collapse. We assume
that all overloaded pillars fail simultaneously and their load is again
redistributed because all failed pillars carry no load. The second employed
loading procedure is the
application of the finite force to the system. In this approach the external load
is kept constant during the entire loading process. After the application of
load ![]() , all the nanopillars with strength-thresholds smaller than
, all the nanopillars with strength-thresholds smaller than ![]() fail immediately and possible further failures are the result only of the load
redistributions.
fail immediately and possible further failures are the result only of the load
redistributions.
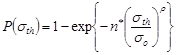
The applied load transfer rule is based on
the hierarchical load sharing protocol [11]. Suppose that the pillars are
grouped in a hierarchical way (see Fig. 1).
At the lowest hierarchy level, the system is seen as a set of pillars. At the
second level, the pillars form groups (clusters) containing ![]() nearest neighbours from
the lowest level - it’s a neighbourhood of the order 1. In the third level, a
group
of the
nearest neighbours from
the lowest level - it’s a neighbourhood of the order 1. In the third level, a
group
of the ![]() nearest groups from the second
level is the neighbourhood of the order 2. In the fourth level,
nearest groups from the second
level is the neighbourhood of the order 2. In the fourth level, ![]() nearest groups from the third
level form neighbourhood of the order 3 etc. Therefore, we assume clustering of
the pillars in the sense of their close arrangement within the groups. The
effective range of interaction is restricted to pillars belonging to the same
group (cluster) of the lowest possible level.
This means that, if possible, the load from the broken pillar is shifted
equally to all intact pillars from its neighbourhood of the order 1. If all
pillars in this neighbourhood are broken, the load is equally transferred to
all intact pillars from the neighbourhood of the order 2 etc. In the original
version of the HLS [11], if all the elements in the cluster are broken, the
load is transferred to the cluster of the higher level and is redistributed
equally among all the sub-clusters of this higher-level cluster. In our
calculations, the number of hierarchy levels
nearest groups from the third
level form neighbourhood of the order 3 etc. Therefore, we assume clustering of
the pillars in the sense of their close arrangement within the groups. The
effective range of interaction is restricted to pillars belonging to the same
group (cluster) of the lowest possible level.
This means that, if possible, the load from the broken pillar is shifted
equally to all intact pillars from its neighbourhood of the order 1. If all
pillars in this neighbourhood are broken, the load is equally transferred to
all intact pillars from the neighbourhood of the order 2 etc. In the original
version of the HLS [11], if all the elements in the cluster are broken, the
load is transferred to the cluster of the higher level and is redistributed
equally among all the sub-clusters of this higher-level cluster. In our
calculations, the number of hierarchy levels ![]() varies
from 2 to 6.
varies
from 2 to 6.
![]() is called a coordination number. It
should be noted that for ease of presentation we have illustrated the system
with
is called a coordination number. It
should be noted that for ease of presentation we have illustrated the system
with ![]() in Figure 1.
in Figure 1.
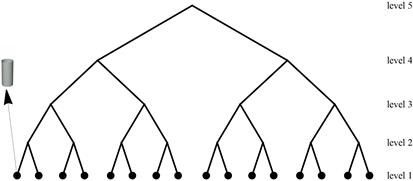
Fig. 1. Scheme of
the system with coordination number ![]() and
five levels
of hierarchy. System size
and
five levels
of hierarchy. System size ![]()
3. Analysis of the simulation results
Based on the FBM with HLS, a computer program was developed in order to simulate damage processes in the nanopillar arrays. Intensive computer simulations are conducted for the two loading procedures, mentioned in the previous section.
Let us consider a quasi-static loading
procedure. The destruction of the system proceeds in an avalanche-like manner -
each increase of the external load induces cascade or cascades of simultaneous
pillar failures. The cascades of failures
provoked by the increment of the external load form an avalanche (![]() ).
).
One of the most important properties is the
strength of the system, i.e. the mean
value of load at which a system composed of ![]() pillars fail. This quantity can
serve
as a predictor of the collapse of the system. In the
quasi-static case, the system
failure is caused by attaining critical load
pillars fail. This quantity can
serve
as a predictor of the collapse of the system. In the
quasi-static case, the system
failure is caused by attaining critical load ![]() The application of the load
The application of the load ![]() is the last stage of
the system destruction and during this stage many cascades of failures
evolve to create a catastrophic (critical) avalanche (
is the last stage of
the system destruction and during this stage many cascades of failures
evolve to create a catastrophic (critical) avalanche (![]() ).
).
In the following considerations, we will use
values of catastrophic avalanche
sizes and critical loads scaled by the initial system
sizes: ![]() and
and ![]() .
.
The plots of the mean critical load ![]() as a function of the
system size
as a function of the
system size ![]() are shown in Figures 2-4.
As we see from these plots, mean critical load
are shown in Figures 2-4.
As we see from these plots, mean critical load ![]() is
a decreasing function of
is
a decreasing function of ![]() and numerical
data can be fitted by the formula:
and numerical
data can be fitted by the formula:
| (2) |
where ![]() are coefficients obtained from
simulation results. From Figures 2 and 3, it is also seen that the mean
critical load decreases with increasing the number of hierarchy levels. This is
consistent with conclusion for the original HLS that the increase in the number
of hierarchy levels leads to lower strength of material [9-11]. However, it
should be noted that the decrease of the critical loads slows down with the
increasing number of hierarchy levels. For example, the difference between mean
critical loads for
are coefficients obtained from
simulation results. From Figures 2 and 3, it is also seen that the mean
critical load decreases with increasing the number of hierarchy levels. This is
consistent with conclusion for the original HLS that the increase in the number
of hierarchy levels leads to lower strength of material [9-11]. However, it
should be noted that the decrease of the critical loads slows down with the
increasing number of hierarchy levels. For example, the difference between mean
critical loads for ![]() and
and ![]() (
(![]() , see
Figure 2) is almost negligible in comparison with difference between results
for
, see
Figure 2) is almost negligible in comparison with difference between results
for ![]() and
and ![]()
Fig. 2. The mean
critical load ![]() versus
system size
versus
system size ![]() for different number
of hierarchy levels and
for different number
of hierarchy levels and ![]() . The averages are
taken from at least 1000 samples
for each presented value. The dashed lines represent
function (2)
with parameters computed from simulations
. The averages are
taken from at least 1000 samples
for each presented value. The dashed lines represent
function (2)
with parameters computed from simulations
Fig. 3. The mean critical load
![]() versus system size
versus system size ![]() for different number
of hierarchy levels and
for different number
of hierarchy levels and ![]() . The averages are
taken from at least 1000 samples
for each presented value. The dashed lines represent
function (2)
with parameters computed from simulations
. The averages are
taken from at least 1000 samples
for each presented value. The dashed lines represent
function (2)
with parameters computed from simulations
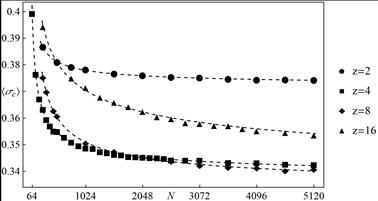
Fig. 4. The mean critical load
![]() versus system size
versus system size ![]() for different
coordination numbers and
for different
coordination numbers and ![]() . The averages are
taken from at least 1000 samples
for each presented value. The dashed lines represent
function (2)
with parameters computed from simulations
. The averages are
taken from at least 1000 samples
for each presented value. The dashed lines represent
function (2)
with parameters computed from simulations
Here, we consider the influence of
coordination number ![]() on the damage
resistance of the system. Figure 4 shows mean critical loads for different
values
of
on the damage
resistance of the system. Figure 4 shows mean critical loads for different
values
of ![]() and
and ![]() It
can be seen, excluding smallest systems, that the systems with elements paired
in sequential order (
It
can be seen, excluding smallest systems, that the systems with elements paired
in sequential order (![]() ) are the strongest ones. The
weakest
systems are those with middle coordination numbers (
) are the strongest ones. The
weakest
systems are those with middle coordination numbers (![]() and
and ![]() ). Initially
the systems with
). Initially
the systems with ![]() have the smallest
have the smallest ![]() but with increasing system size
the critical loads for the arrays with
but with increasing system size
the critical loads for the arrays with ![]() decrease
more quickly. The systems with the
biggest coordination number (
decrease
more quickly. The systems with the
biggest coordination number (![]() ) initially are the strongest, but their
) initially are the strongest, but their ![]() decrease more rapidly than in the systems with
decrease more rapidly than in the systems with ![]() Apparently,
there is no
ordering of critical loads in the relation to the coordination number. We will
return to this in the last part of this section.
Apparently,
there is no
ordering of critical loads in the relation to the coordination number. We will
return to this in the last part of this section.
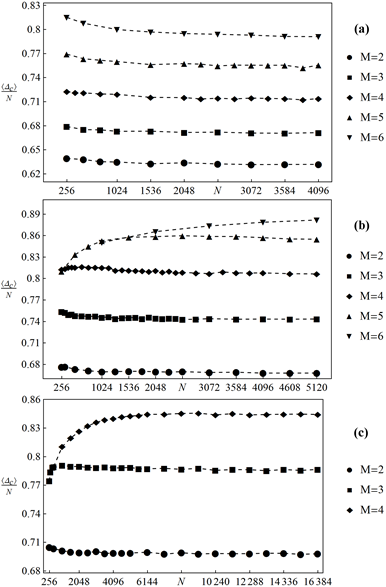
Fig. 5. The fraction
of pillars destroyed during critical avalanche versus system size ![]() for
for ![]() (a),
(a), ![]() (b) and
(b) and ![]() (c).
The data are averaged over at least
1000 realizations for each presented value
(c).
The data are averaged over at least
1000 realizations for each presented value
During a critical
avalanche, an important fraction of ![]() pillars
fails instantly. More specifically, most of the pillars are destroyed during
the final avalanche.
It is worth analysing the sizes of critical avalanches because the degree of
the system destruction can be an indicator of the forthcoming system failure.
Figure 5 shows the mean sizes of the normalized catastrophic avalanches as a
function
of
pillars
fails instantly. More specifically, most of the pillars are destroyed during
the final avalanche.
It is worth analysing the sizes of critical avalanches because the degree of
the system destruction can be an indicator of the forthcoming system failure.
Figure 5 shows the mean sizes of the normalized catastrophic avalanches as a
function
of ![]() One can see that
the ordering reported for the critical loads is reversed -
the bigger the number of hierarchy levels the greater the normalized
catastrophic avalanche. In some cases
One can see that
the ordering reported for the critical loads is reversed -
the bigger the number of hierarchy levels the greater the normalized
catastrophic avalanche. In some cases ![]() initially
increases, but eventually it is a nonincreasing function of
initially
increases, but eventually it is a nonincreasing function of ![]() This conclusion is in contrast with the
results obtained
for both the GLS and LLS rules, for
which
This conclusion is in contrast with the
results obtained
for both the GLS and LLS rules, for
which ![]() is an increasing function of
is an increasing function of ![]() [4, 5]. One exception to the
reported rule is the system with
[4, 5]. One exception to the
reported rule is the system with ![]() and
and ![]() However, for this case, due to
computational time, we did not simulate systems with
However, for this case, due to
computational time, we did not simulate systems with ![]()
In the last part
of this section we analyse probabilities of breakdown of nano-
pillar arrays loaded by finite force ![]() For
this loading procedure, the initial load
For
this loading procedure, the initial load ![]() of
all pillars is equal, and the total load
of
all pillars is equal, and the total load ![]() is
conserved during the loading process. Under such a loading procedure, three
states of the system can be reached. If the initial load
is
conserved during the loading process. Under such a loading procedure, three
states of the system can be reached. If the initial load ![]() is smaller than any of the
pillar-strength-thresholds all the pillars remain intact. Application of the
finite force can also lead to partial damage - the system reaches a steady
state after cascades of pillar failures.
Cascades may also be self-sustained until destruction of all the pillars i.e.
the state of complete breakdown.
is smaller than any of the
pillar-strength-thresholds all the pillars remain intact. Application of the
finite force can also lead to partial damage - the system reaches a steady
state after cascades of pillar failures.
Cascades may also be self-sustained until destruction of all the pillars i.e.
the state of complete breakdown.
The simulation results for a different number of hierarchy levels are shown in Figures 6 and 7. It is seen from these plots that the ordering stated for the critical loads under quasi-static loading is preserved.
As shown in
Figures 6-9, breakdown probability as a function of initial load
per pillar ![]() can be nicely
fitted by the function:
can be nicely
fitted by the function:
| (3) |
where ![]() and
and ![]() are coefficients obtained from
simulation results,
are coefficients obtained from
simulation results, ![]() represents complimentary
error function:
represents complimentary
error function:
| (4) |
The function (3) is a cumulative distribution
function of the Gaussian distribution with mean ![]() and
variance
and
variance ![]()
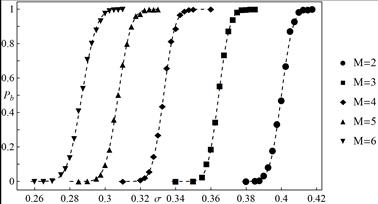
Fig. 6. Empirical breakdown probability ![]() as a
function of initial load per pillar
as a
function of initial load per pillar ![]() for a different number of hierarchy levels and coordination number
for a different number of hierarchy levels and coordination number ![]() All presented data are calculated from
1000 statistically independent samples. System size
All presented data are calculated from
1000 statistically independent samples. System size ![]() The
dashed lines represent function (3) with parameters computed from simulations
The
dashed lines represent function (3) with parameters computed from simulations
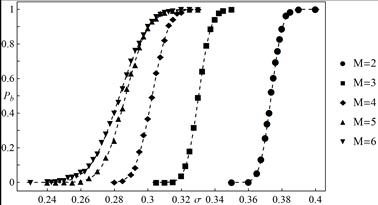
Fig. 7. Empirical breakdown probability ![]() as a
function of initial load per pillar
as a
function of initial load per pillar ![]() for a different number of hierarchy levels and coordination number
for a different number of hierarchy levels and coordination number ![]() All presented data are calculated from
1000 statistically independent samples. System size
All presented data are calculated from
1000 statistically independent samples. System size ![]() The
dashed lines represent function (3) with parameters computed from simulations
The
dashed lines represent function (3) with parameters computed from simulations
Figures 8 and 9
present probabilities of breakdown for a given number of hierarchy levels. It
is seen that these probabilities are not ordered according to coordination
number. This fact can be explained as follows: after destruction of the pillar
the load is equally redistributed to its intact neighbours of the lowest
possible level. It is appropriate to
introduce a distinction between load transfer to the neighbourhood of
the highest level i.e. to all the intact pillars in the system (global load
transfer) and load transfer to intact
neighbours of lower levels. The first load transfer is much
more dispersed compared to the second one. It has been observed that
with increase of ![]() the number of highest level
load transfers decreases and the number of lower level load transfers
increases. Hence, the global load transfer is partially replaced by more local
transfer and this initially leads to decreasing strength. However,
the local transfer becomes more and more
dispersed as
the number of highest level
load transfers decreases and the number of lower level load transfers
increases. Hence, the global load transfer is partially replaced by more local
transfer and this initially leads to decreasing strength. However,
the local transfer becomes more and more
dispersed as ![]() is increased - this, in turn,
leads to increasing strength. As can be seen from Figures 4 and 8, for
is increased - this, in turn,
leads to increasing strength. As can be seen from Figures 4 and 8, for ![]() and
and ![]() , it
seems that impact of the two ranges of load transfer almost compensate
to give similar results.
, it
seems that impact of the two ranges of load transfer almost compensate
to give similar results.
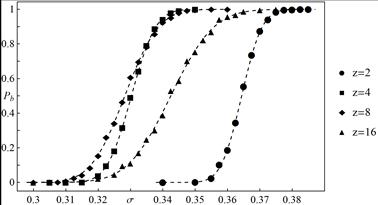
Fig. 8. Empirical breakdown probability ![]() as a
function of initial load per pillar
as a
function of initial load per pillar ![]() for different values of
for different values of ![]() and
and
![]() All presented data are calculated from
1000 statistically independent samples. System size N = 4096. The dashed
lines represent function (3) with parameters computed from simulations
All presented data are calculated from
1000 statistically independent samples. System size N = 4096. The dashed
lines represent function (3) with parameters computed from simulations
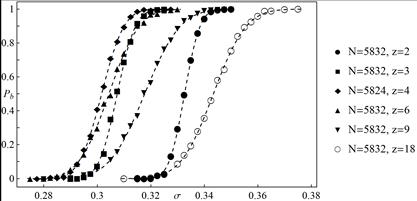
Fig. 9. Empirical breakdown probability ![]() as a
function of initial load per pillar
as a
function of initial load per pillar ![]() for different values of
for different values of ![]() and
and
![]() All presented data are calculated
from 1000 statistically independent samples. The dashed lines represent
function (3) with parameters computed from simulations
All presented data are calculated
from 1000 statistically independent samples. The dashed lines represent
function (3) with parameters computed from simulations
4. Conclusions
In this paper, the computational studies of mechanical damage in the axially loaded nanopillar arrays have been discussed. Due to clustering of the pillars, we applied the load transfer rule based on the hierarchical load sharing protocol.
We have performed
a series of simulations considering two different, but equivalent loading
procedures. For the quasi-static loading we have noticed that
the mean critical load is a decreasing function of the system size and it can
be fitted by the function (2). Mean critical loads decrease as the number of
hierarchy level is increased and the scaled catastrophic avalanche size is
eventually nonincreasing function of ![]() . For the case of finite force loading,
we have shown that breakdown probabilities can be approximated by the function
being a cumulative distribution function of the Gaussian distribution. We
compared probabilities of breakdown
for different values of the coordination number and different number of
hierarchy levels.
. For the case of finite force loading,
we have shown that breakdown probabilities can be approximated by the function
being a cumulative distribution function of the Gaussian distribution. We
compared probabilities of breakdown
for different values of the coordination number and different number of
hierarchy levels.
References
[1] Herrmann H.J., Roux S. (eds.), Statistical Models for the Fracture of Disordered Media, North Holland, Amsterdam 1990 and references therein.
[2] Chakrabarti B., Benguigui L.G., Statistical Physics of Fracture and Breakdown in Disordered Systems, Claredon Press, Oxford 1997.
[3] Alava M.J., Nukala P.K.V.V., Zapperi S., Statistical models of fracture, Adv. In Physics 2006, 55, 349-476.
[4] Domański Z., Derda T., Sczygiol N., Statistics of critical avalanches in vertical nanopillar arrays, Lecture Notes in Electrical Engineering 2014, 275, 1-11.
[5] Derda T., Stochastic local load redistribution in the fibre bundle model of nanopillar arrays, J. Appl. Math. Comput. Mech. 2015, 14(4), 19-30.
[6] Pradhan S., Hansen A., Chakrabarti B.K., Failure processes in elastic fiber bundles, Rev. Mod. Phys. 2010, 82, 499-555.
[7] Hansen A., Hemmer P.C., Pradhan S., The Fiber Bundle Model: Modeling Failure in Materials, Wiley 2015.
[8] Kun F., Raischel F., Hidalgo R.C., Herrmann H.J., Extensions of fibre bundle models, Lecture Notes in Physics 2006, 705, 57-92.
[9] Newman W.I., Gabrielov A.M., Failure of hierarchical distributions of fibre bundles. I, Int. J. Fract. 1991, 50(1), 1-14.
[10] Gómez J.B., Pacheco A.F., Size-frequency distribution of earthquakes in hierarchically organized load-transfer models, Nonlin. Processes Geophys. 1997, 4, 207-211.
[11] Mishnaevsky L. Jr., Hierarchical composites: Analysis of damage evolution based on fibre bundle model, Compos. Sci. Technol. 2011,71, 450-460.
[12] Pugno N.M., Ruoff R.S., Nanoscale Weibull statistics, J. Appl. Phys. 2006, 99, 024301-4.
[13] Pugno N.M., Ruoff R.S., Nanoscale Weibull statistics for nanofibers and nanotubes, J. Aerosp. Eng. 2007, 20, 97-101.