Conditions and limitations of digital satellite image pre-processing for the further 3D modeling
V.V. Hnatushenko
,O.O. Kavats
,M. Kubanek
,Y.O. Kibukevych
Journal of Applied Mathematics and Computational Mechanics |
 Download Full Text |
 View in HTML format |
 Export citation |
@article{Hnatushenko_2016,
   doi = {10.17512/jamcm.2016.3.06},
   url = {https://doi.org/10.17512/jamcm.2016.3.06},
   year = 2016,
   publisher = {The Publishing Office of Czestochowa University of Technology},
   volume = {15},
   number = {3},
   pages = {57--65},
   author = {V.V. Hnatushenko and  O.O. Kavats and  M. Kubanek and  Y.O. Kibukevych},
   title = {Conditions and limitations of digital satellite image pre-processing for the further 3D modeling},
   journal = {Journal of Applied Mathematics and Computational Mechanics}
}
TY - JOUR DO - 10.17512/jamcm.2016.3.06 UR - https://doi.org/10.17512/jamcm.2016.3.06 TI - Conditions and limitations of digital satellite image pre-processing for the further 3D modeling T2 - Journal of Applied Mathematics and Computational Mechanics JA - J Appl Math Comput Mech AU - Hnatushenko, V.V. AU - Kavats, O.O. AU - Kubanek, M. AU - Kibukevych, Y.O. PY - 2016 PB - The Publishing Office of Czestochowa University of Technology SP - 57 EP - 65 IS - 3 VL - 15 SN - 2299-9965 SN - 2353-0588 ER -
Hnatushenko, V., Kavats, O., Kubanek, M., & Kibukevych, Y. (2016). Conditions and limitations of digital satellite image pre-processing for the further 3D modeling. Journal of Applied Mathematics and Computational Mechanics, 15(3), 57-65. doi:10.17512/jamcm.2016.3.06
Hnatushenko, V., Kavats, O., Kubanek, M. & Kibukevych, Y., 2016. Conditions and limitations of digital satellite image pre-processing for the further 3D modeling. Journal of Applied Mathematics and Computational Mechanics, 15(3), pp.57-65. Available at: https://doi.org/10.17512/jamcm.2016.3.06
[1]V. Hnatushenko, O. Kavats, M. Kubanek and Y. Kibukevych, "Conditions and limitations of digital satellite image pre-processing for the further 3D modeling," Journal of Applied Mathematics and Computational Mechanics, vol. 15, no. 3, pp. 57-65, 2016.
Hnatushenko, V.V., O.O. Kavats, M. Kubanek, and Y.O. Kibukevych. "Conditions and limitations of digital satellite image pre-processing for the further 3D modeling." Journal of Applied Mathematics and Computational Mechanics 15.3 (2016): 57-65. CrossRef. Web.
1. Hnatushenko V, Kavats O, Kubanek M, Kibukevych Y. Conditions and limitations of digital satellite image pre-processing for the further 3D modeling. Journal of Applied Mathematics and Computational Mechanics. The Publishing Office of Czestochowa University of Technology; 2016;15(3):57-65. Available from: https://doi.org/10.17512/jamcm.2016.3.06
Hnatushenko, V.V., O.O. Kavats, M. Kubanek, and Y.O. Kibukevych. "Conditions and limitations of digital satellite image pre-processing for the further 3D modeling." Journal of Applied Mathematics and Computational Mechanics 15, no. 3 (2016): 57-65. doi:10.17512/jamcm.2016.3.06
CONDITIONS AND LIMITATIONS OF DIGITAL SATELLITE IMAGE PRE-PROCESSING FOR THE FURTHER 3D MODELING
V.V. Hnatushenko 1, O.O. Kavats 2, M. Kubanek 3, Y.O. Kibukevych2,3
1
O. Honchar Dnepropetrovsk National University
Dnepropetrovsk, Ukraine
2 National Metallurgical Academy of Ukraine
Dnepropetrovsk, Ukraine
3 Institute of Computer and Information Science, Czestochowa
University of Technology
Częstochowa, Poland
vvgnat@ukr.net, alena_kavats@mail.ru
mariusz.kubanek@icis.pcz.pl, yuliya_shpak_2012@mail.ru
Abstract. Today, 3D models of complex urban buildings are one of the most popular applications of 3D modeling. 3D models of complex urban buildings provide high data interpretation that accurately transfers information about objects or area changes and allows one to solve a number of applied tasks. The quality of the 3D models depends on the quality of the initial images and the method of the object recognition. First of all, the 3D-model building requires identification and classification building borders, which requires determination of the building roof form. The article reviews the existing classification and recognition methods for the 3D further modeling.
Keywords: photogrammetric images, classification, segmentation, building detection, roof detection, 3D models
1. Introduction
In recent years, digital images obtained by remote sensing methods or conventional digital cameras have became important in various modern industries. Processing of these images is one of the most important steps in creating 3D spatial models of cities with a high degree of detail. The 3D city models provide high data interpretation, transfer information about changes of certain objects or areas more accurately and also achieve a number of applications that cannot be realized with the traditional two-dimensional maps. For example, analysis of the 3D models allows one to see the location of buildings that are unattainable in normal conditions, add or remove buildings, estimate how they affect the area and its characteristics, and more.
2. Analysis of recent research and publications
The general solution of the building identifying is to identify data (e.g., lines, angles, shapes, planes, etc.) and then group it by its geometric characteristics (Fig. 1).
![]()
Fig. 1. General scheme of the image recognition
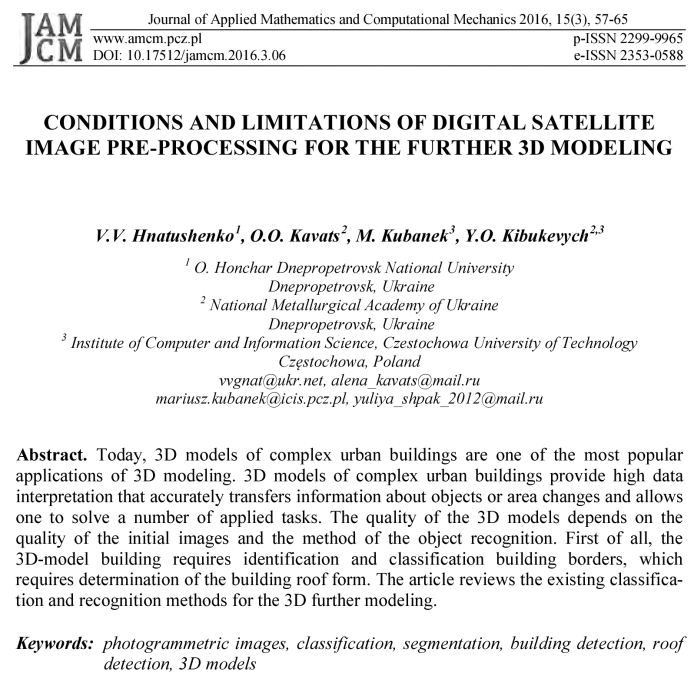
Because of the noise or not object’s components some line or plane may be missing on the image, making it difficult to perform automatic methods with minimal errors. Also, a significant problem in the recognition is that the most modern buildings have forms that do not comply with the standard geometric features (Fig. 2).
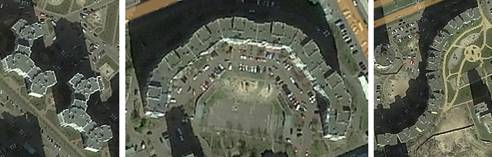
Fig. 2. Example of non-standard forms of the modern buildings
In [1], an automated method of the object recognizing by their geometric characteristics is proposed. The method combines the classification, contour and marginal approaches that allow us to solve the problem of the recognition in an automatic mode. The method should be used to the different-time images and objects that have simple geometric shapes. In [2] an object identifying method based on the clustering, which provides the cluster formation with local features (such as pixel intensity, texture and geometric features), obtained using different methods of extracting features is presented. The experimental results showed that the method can be applied not only in building recognition, but also in distinguishes different types of the roof construction (shed, gable or flat).
After analyzing the modern detection methods, it can be concluded that most of them do not correspond to the task of building recognition. Frequently, the recognition algorithms do not take into account the modern complex geometry of roofs. Therefore, there is a necessity to develop a new recognition method for the complex building objects with the further 3D modeling.
3. Formulation purposes of article
Construction of high-quality 3D model cities depends on the quality of the initial images and on the subsequent object recognition. First of all, an important step is the border identification and classification of building forms. Today there are many problems in building recognition: the geometric and color distortion, presence of noise, impact of the imposition of different objects, depending on the time of day and weather conditions and others. Therefore, special importance is placed on developing a new building recognition method that would allow us to reduce identification errors of the images for the further research. The aim of this work is a detailed review and analysis of the existing building recognition methods on the photogrammetric images.
4. Main part
The spatial resolution of the input multispectral image is important for the quality of the object recognition. Repeatedly there are various kinds of distortions in the images that complicate further processing: noise, color and geometric distortions, and more. Presented in [3-5], algorithms of increasing information content and image quality will help to avoid such problems and speed up the processing time. Therefore, using the previous algorithm at the stage of recognition and 3D modeling is necessary.
Traditionally, the statistical models of classification are used for photogram- metric image recognition, which can be controlled (supervised) or uncontrolled (unsupervised) [6, 7]. Figure 3 shows a scheme of the classification methods.
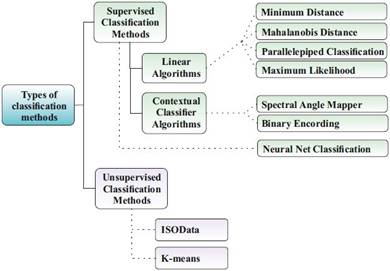
Fig. 3. Scheme of the classification methods
A classification without training (unsupervised) is a process in which the distribution of pixels occurs automatically, based on analysis of statistical distribution of pixel brightness. It should be noted that before the beginning of the classification it is unknown how many objects are in the image, and after the classification it is necessary to decrypt obtained classes. During the classification with training (supervised), brightness value of each pixel is compared with the initial. As a result, each pixel belongs to the most appropriate class of objects.
An uncontrolled classification method, compared to a controlled, has important disadvantages. Firstly, often there are mismatches of created classes to the set classes, and secondly, there is a restriction in controlling classes and their properties. Therefore, controlled methods of the classification are used for complex object recognition that allows one to accurately identify a class. Typically, all methods of the supervised classification have a sequence of operations:
– identification a region of interest,
– extracting the objects,
– image classification.
The work on the researched classification methods was held by the primary multispectral image from the WorldView-2 satellite (Fig. 4). Figure 5 shows results of the controlled classification algorithms. It should be noted that any classification with training is more time-consuming, and the quality of the classification depends on the quality of selected training areas. Usually, two or three training areas are selected. The higher is amount of selected training areas, the better will be the results. This procedure provides both classification accuracy and interpretation credibility of the results.
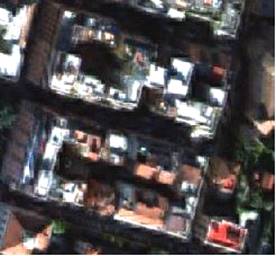
Fig. 4. Example of the input photogrammetric image from the WorldView-2 satellite
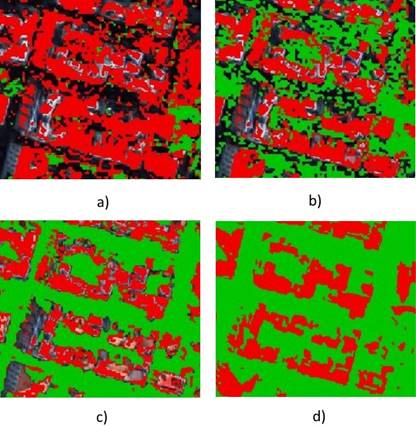
![]() - class of «Buildings»;
- class of «Buildings»; ![]() - class of «Trees»
- class of «Trees»
Fig. 5. Photogrammetric image after the controlled classification: a) spectral angle mapper method, b) mahalanobis distance method, c) maximum likelihood method, d) minimum distance method
The building contours provide initial information about buildings, and point out their exact position and shape. The existing detection methods use color contrast between the building roof and the surrounding land or objects to find the buildings boundary. However, very often, the asphalt roads may have the same color as the building roofs in the optical imagery. This can lead to a spectral “mixing” of buildings and objects. A similar problem arises when the buildings are surrounded by trees. As a result, it leads to a low accuracy of building and roof contour extraction and complicates the future of 3D model building.
A shape is an unchanged geometric feature of a building, which weakly depends on the shooting conditions. Usually, the building forms correspond to the roof contours. The main types of roofs are shown in Figure 6.
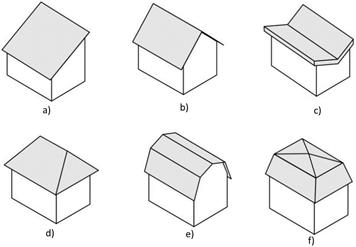
Fig. 6. Examples of the main types of the building roofs: a) shed roof, b) gable roof, c) the roof “Butterfly”, d) hipped roof, e) gambrel roof, e) mansard roof
Depending on the slope, roofs are sloped (over 10%) and flat (up 2.5%). Usually, gently pitched and pitched roofs are used in individual housing construction. The shape of the roof can be shed, gable, three-, fourslope or manyslope. A shed roof is used mainly in non-residential areas such as terraces and verandas. A gable roof consists of two planes and has a slope to the perimeter of the building; it is typical for small individual houses. A hipped roof consists of four or more same slopes that converge at one point. Each slope has a triangular shape. This roof is suitable for the buildings with a square plan or plan in the form of a regular polygon. Successful identification of the typical roof provides a solid foundation for the complex 3D model building.
A building height is another important parameter for recognition. Technically, the building has no constant “height”, so that the roof cannot be completely flat [8]. In addition, most satellites have limited detection capabilities of such parameters and can only estimate the average height of each building. However, the average height of the building provides the valuable information about building volume. Considering the constant height, it is possible to extract the building contours and reconstruct an approximate 3D model. Thus, the height of the building is an important component for the transformation from a two-dimensional model of the building to its 3D-model.
The height of the building can be obtained from the remote sensing data through various methods. The ratio of building height to shadow length is constant on the image and depends on the zenith angle of the sun and in most cases indicates a height. If you measure an object and the length of its shadow, then, according to these parameters, we can calculate the height of other buildings by the Equation (1):
| (1) |
where: θ - the zenith angle of the Sun, h0 and s0 - the height of the closest object to the building and the length of its shadow.
However, it should be taken into account that the shadows depend on the position of the sun and features of the environment [9, 10]. The building template footprints help to identify a complex building on the image. The combination of the object features and brightness information improves the accuracy of matches. However, there is no parameter for determining the brightness difference between the building and its background. The roofs do not have a constant color because they can change during the day or by the environmental conditions. Also, the roof color can coincide with the color of the background, which complicates the recognition. To find the building roofs in the image, the template moves along the edge of images with the aim of finding the optimal match. The coefficient of matching the initial image with the template is a ratio of the intersection edge length to the total length of the template edge and is calculated as:
| (2) |
where: T - the set of template boundary pixel, E - the set of boundary pixels in the resulting image, Ç - the intersection of two sets, | | - the capacity (number of elements) of the set.
The building identification errors can be caused by many factors, including shadows, occlusion, smoothing restrictions in the matching algorithms or discrepancy of very tall buildings. To improve the recognition accuracy, existing methods are effectively improved by the addition of the two-dimensional maps. The methodology of the building data extraction can change from simple to complex, from 2D to 3D. Different characteristics (color, shape or height) that separate buildings from the environment help to identify the building in the image. With the inclusion of the additional images and photogrammetric images with the ultra-high spatial resolution, details on roofs can be recovered. After the recognition procedure, considering all the above features and geometric characteristics, a 3D-building can be easily reconstructed in case of flat land and simple vertical walls.
5. Experimental results
Recognition results of the complex building photogrammetric images are evaluated by different strategies. Traditionally, we use the image classification accuracy assessment. After the image classification, the output data consists of extracted buildings or objects and the background. The classified image is compared with the reference image by different parameters to conduct the evaluation and obtain metrics [10]. The “Completeness” represents the percentage of buildings that are correctly identified with respect to the reference image:
| (3) |
where: TP - the common area of extracted and reference objects, FN - the area of reference objects.
The “Correctness” describes the percentage of correctly identified buildings in the entire area:
| (4) |
where FP - the area of extracted objects.
The “Quality” is a metric that combines the value of “Completeness” and “Correctness”:
| (5) |
The results are shown in Table 1.
Table 1
Results of the image classification accuracy assessment 1
|
|
Completeness |
Correctness |
Quality |
|
Spectral angle mapper method |
0.8381 |
0.5714 |
0.5146 |
|
Mahalanobis distance method |
0.6592 |
0.6744 |
0.5000 |
|
Maximum likelihood method |
0.6392 |
0.6966 |
0.5000 |
|
Minimum distance method |
0.5932 |
0.7610 |
0.5000 |
7. Conclusions and further researches
The latest achievements in computer science encourage development of new and improved methods of building detection. Most of these methods have significant restrictions in the automatic data delectation. Complications of recognition can occur in the case of the presence of dense buildings in such areas as urban, suburban and rural. In addition, there are restrictions associated with shape, color and size of buildings, which complicate the image processing.
The overall analysis and the results of the comparative study of classification methods showed that the Spectral angle mapper method gave the highest values of Completeness and Quality which indicates better recognition of building objects in satellite images. It can be concluded that these assessment criteria of classification can be used for the further building recognition.
Efficiency and stability of the data extraction methods allow save time and labor costs to provide other image applications with useful data base. Our future research will focus on the development of a new information technology of the digital photogrammetric image recognition with the aim of improving the reconstruction of complex 3D models.
References
[1] Lu D., Weng Q., A survey of image classification methods and techniques for improving classification performance, International Journal of Remote Sensing 2007, 28, 823-870.
[2] Tso B., Mather P.M., Classification Methods for Remotely Sensed Data, Taylor and Francis Inc., New York 2001.
[3] Hnatushenko V.V., Hnatushenko Vik.V., Kavats A.A., Shevchenko V.Ju., Pansharpening technology of high resolution multispectral and panchromatic satellite images, Scientific Bulletin of National Mining University, State Higher Educational Institution “National Mining University”, Dnipropetrovsk 2015, 4(148), 91-98.
[4] Hnatushenko V.V., Kavats О.О., Kibukevych I.O., Efficiency Determination of Scanner Data Fusion Methods of Space Multispectral Images, International Young Scientists Forum on Applied Physics «YSF-2015», September 29 - October 2, 2015, Dnipropetrovsk 2015.
[5] Hnatushenko V., Kavats A., Information technology increase spatial fragmentation of digital satellite images based on wavelet transformation and IСA, Proceedings of the National University “Lviv Polytechnic” series “Computer Science and Information Technology”, Lviv 2013, 28-32.
[6] Hay G.J., Castilla G., Object-based image analysis: strengths, weaknesses, opportunities and threats (SWOT), International Archives of Photogrammetry, Remote Sensing and Spatial Information Sciences 2006, 36(4).
[7] Li M., Zang S., Zhang B., Li S., Wu C., A review of remote sensing image classification techniques: The role of spatio-contextual information, European Journal of Remote Sensing 2014, 47, 389-411.
[8] Pacifici F., Chini M., Emery W.J., A neural network approach using multi-scale textural metrics from very high-resolution panchromatic imagery for urban land-use classification, Remote Sensing of Environment 2009, 113, 1276-1292.
[9] Zhen Z., Quackenbush L.J., Stehman S.V., Zhang L., Impact of training and validation sample selection on classification accuracy and accuracy assessment when using reference polygons in object-based classification, International Journal of Remote Sensing 2013, 34(19), 6914-6930.
[10] Zeng C., Wang J., Automated Building Information Extraction and Evaluation from High-resolution Remotely Sensed Data, The University of Western Ontario, Electronic Thesis and Dissertation Repository, 2014.